Election forecast tracks Georgia’s Senate runoffs
Model uses hourly data from betting markets to provide daily prediction updates
- Link to: Northwestern Now Story
- Data scientist’s 2020 presidential election predictions were more accurate than competing forecasts
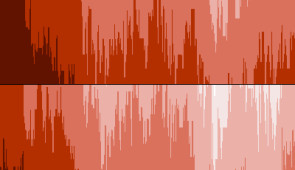
- Election predictions are visualized in political horizon plots, using color gradients to represent stronger or weaker candidate advantages
- Model currently predicts Republicans to win both senate seats
Following his successful 2020 presidential election forecast, a Northwestern University data scientist has turned his attention to runoff elections for Georgia’s two U.S. Senate seats.
Using data from betting markets, Northwestern’s Thomas Miller developed a new model that tracks the progress of political campaigns hour by hour and day by day. At the time of this press release, Miller’s system predicts Republicans to win both Senate seats.
“My forecasts are driven by prediction markets, which are more reliable than opinion polls,” Miller said. “Prediction markets have a key advantage. As bettors buy and sell shares of candidates, prices change. This means that forecasts driven by prediction markets can continuously change.”
Miller is the faculty director of the master’s in data science program in Northwestern’s School of Professional Studies. Viewers can follow his daily predictions via Data Science Quarterly and on Twitter.
Called The Virtual Tout, Miller’s model proved its uncanny accuracy during the 2020 presidential election. Using data from PredictIt — a prediction market in which users bet real money on political races — the model provided hourly election forecasts beginning Sept. 27 and ending on Election Day, Nov. 3.
In the end, The Virtual Tout forecast predicted a Biden-Harris win with 294 electoral votes. With the Electoral College ultimately casting 306 votes for the Biden-Harris ticket, Miller’s model was more accurate than FiveThirtyEight, which forecasted 348 electoral votes for Biden-Harris.
Striving to make his model even more accurate, Miller recently introduced a new invention that he calls “political horizon plots.” Instead of showing one plot for each simulated election, Miller now visualizes the data as horizon graphs to show how a candidate’s prospects change over time. Gradients of red and blue colors show chance-of-winning percentages between Republican incumbents and their Democratic challengers. In these graphs, the deeper the red, the more a Republican has an advantage. Similarly, deep blue indicates a strong advantage for the Democrats.
“With the 2020 presidential campaign, I found myself plotting many pricing and forecasting time series,” Miller said. “I wanted to look for relationships across time series, matching reds for Republicans against blues for Democrats. A horizon plot was a logical choice for this.”
At the time of this release, The Virtual Tout forecasts a tighter race between Republican candidate Kelly Loeffler and Democrat Raphael Warnock. The model gives Loeffler a 58.3% chance to win and Warnock a 41.7% chance.
Republican David Perdue has a more comfortable lead over Democrat Jon Ossoff. The model gives Perdue a 63.4% chance of winning and Ossoff a 36.6% chance.
Still, Miller cautions that uncertainty is always at play. Georgia’s betting market favored Donald Trump to win the state during the 2020 presidential election, but Joe Biden ultimately took Georgia. Lower-income voters are less likely to participate in the prediction markets than to vote in elections, Miller said, which could explain the misalignment.
Multimedia Downloads
Political horizon plots
Please credit images to Thomas Miller/Northwestern University