This algorithm makes robots perform better
May 2, 2024
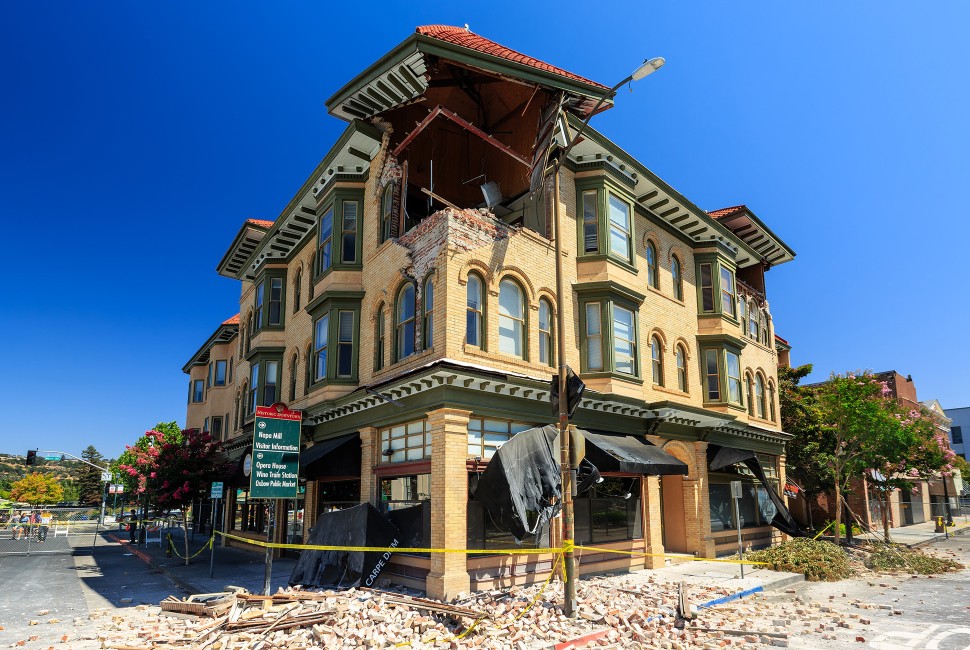
Hazard maps predicting future earthquake shaking are important in the design of earthquake-resistant buildings. Seismologists have been making these maps for about 50 years, but little is known how well they actually forecast shaking, because large damaging earthquakes are infrequent in any area.
A new study by Northwestern University researchers and coworkers examined earthquake hazard maps from five countries and shaking data from past earthquakes and found that all the maps seemed to overpredict the historically observed earthquake shaking intensities.
“We found a puzzling problem,” said geophysicist Leah Salditch, the study’s lead author and a recent Northwestern Ph.D. graduate. “Hazard maps for California as well as Japan, Italy, Nepal and France all seemed to overpredict the historically observed earthquake shaking intensities. The hazard maps were made by groups in different countries, but they all predicted higher shaking than observed.”
In analyzing the possible causes, the researchers discovered the issue was with the conversion equations used in comparing the hazard maps with actual shaking data, rather than systemic problems with the hazard modeling itself.
The findings were published May 1 in the journal Science Advances.
“We started this project 10 years ago and thought there might be serious problems with the hazard maps,” said coauthor Seth Stein, William Deering Professor Emeritus of Earth and Planetary Sciences at Northwestern. “Now it looks like there’s no fundamental problem with them. Because the basic method looks sound, we can expect these maps to be fairly good and get better as we learn more.”
Salditch and two other Northwestern authors, Molly Gallahue and James Neely, are recent Ph.D. graduates from Stein’s group.
Seismologists often say that “earthquakes don't kill people, buildings kill people” — most deaths in an earthquake are caused by collapsing buildings. As a result, society’s best way to reduce deaths in future earthquakes is to construct buildings that should withstand them. However, because earthquake-resistant construction is expensive, communities need to balance its costs with other societal needs. For example, they can decide to put more steel in school buildings or hire more teachers.
To make these tough choices and design appropriately, policymakers and engineers use earthquake hazard maps that predict how much shaking to expect with certain probability over the many years buildings and other structures will be in use. These maps are based on assumptions about where and how often earthquakes in the area may happen, how big they will be and how much shaking they will cause.
In delving into the puzzle of why hazard maps from five different countries all predicted higher shaking than observed, the research team figured there had to be a problem with the maps, the data or both.
“We looked at a number of possible problems with the maps, including the extent that ground shaking depends on local geology, but none of these were big enough to explain the problem,” Gallahue said.
Is the problem with the historical data?
“Probably not,” said coauthor Susan Hough from the U.S. Geological Survey. “The shaking data in the different countries were compiled using different techniques but were all lower than the maps predicted. If anything, historical intensities are expected to be inflated because historical sources tend to emphasize the most dramatic effects of shaking.”
“There’s a subtle problem,” said coauthor Norman Abrahamson of the University of California, Berkeley. “Hazard maps are quoted in physical units, whereas intensities are measured on a different scale, so one must be converted to the other. It turns out the conversion equations don’t work that well for very strong shaking, so converting the map values overpredicts the intensity data.
“The problem isn’t the maps but in the conversion,” he said. “Changing the conversion solves most of the misfit between the maps and data. Moreover, a better description of the ground shaking should make things even stronger.”
“This is an important and satisfying result,” coauthor Neely said. “Maps and data that seemed not to agree were both right. The problem was in comparing the two.”